Tracking marketing performance with Google Analytics

Last updated: 09 August 2020
Google offers a range of free marketing tools that help people track the performance of your online marketing, and of course, your Google Ads performance.
One of the most popular, Google Analytics (or GA for short) has been around since 2005. Google Analytics was one of the first website analytics tools that was free and easy to collect data.
Google Analytics has quickly become the industry standard for tracking the performance of your website. GA is a website data tool to help you measure what drives visitors to the site, what content performs, understand traffic sources and how your digital marketing is performing.
You can quickly install GA by inserting a small piece of Google Analytics tracking code into all of your web pages or landing pages. If you use a Content Management System like WordPress, you can use a plugin so you can avoid touching code at all!
GA allows you to track where your traffic is coming from, whether that be social media campaigns, search ads, organic search, email marketing etc.
How does Google Analytics help your marketing campaigns?
The point of Google Analytics is to allow everyone to track the performance of their websites and marketing efforts. GA ties in with Google's other products to help you measure your return on investment from Google Ads and SEO. Real time reporting tools like this can be the difference between a good financial year and a bad one.
It wasn't too long ago that you had to pay huge amounts of money for collecting and analysing data on active users. Market research, focus groups, big data analysis, and more were out of reach of most small to medium businesses.
These strategies have been simplified and made affordable through programs like Google Analytics that are free and user-friendly. Real time data collection methods allow you to make more powerful, data-driven business decisions.
With some practice using tools like Google Analytics, you can quickly identify areas for improvement and what is performing well. You can identify user experience issues on the website and make improvements quickly. It's a great source of reinforcement for your efforts but makes sure that you're being cost-effective. No business owner or manager needs to be throwing money at something that doesn't produce a return on investment or at the very least, some valuable leads.
It is implied that not every business owner is going to know what their data is telling them. To help simplify the key terms and metrics that you'll be looking at in GA, we've broken them down in this blog.
GA categorises your data into Audience, Acquisition, Behaviour and Conversions. You can also use it to analyse your audience and get real time traffic updates, but your ABC's are your biggest helper.
Acquisition
How did people get to your website? You can find out through Acquisition reports. This is a valuable data source as it shows whether your paid efforts are working or if your primary source of traffic is coming from organic search.
Organic search tells you how many website visitors have found your website via search engines. They search for your company or a related keyword, and click on an unpaid (e.g. not Google Ad) search result.
Improved organic search results are usually achieved through Search Engine Optimisation efforts. SEO is designed to give you higher rankings, as close to number 1 position as possible, and therefore your traffic from search results.
You can track your social media marketing efforts by looking at traffic from the social media source. You can find out how many visitors came from each social media platform in these acquisition reports.
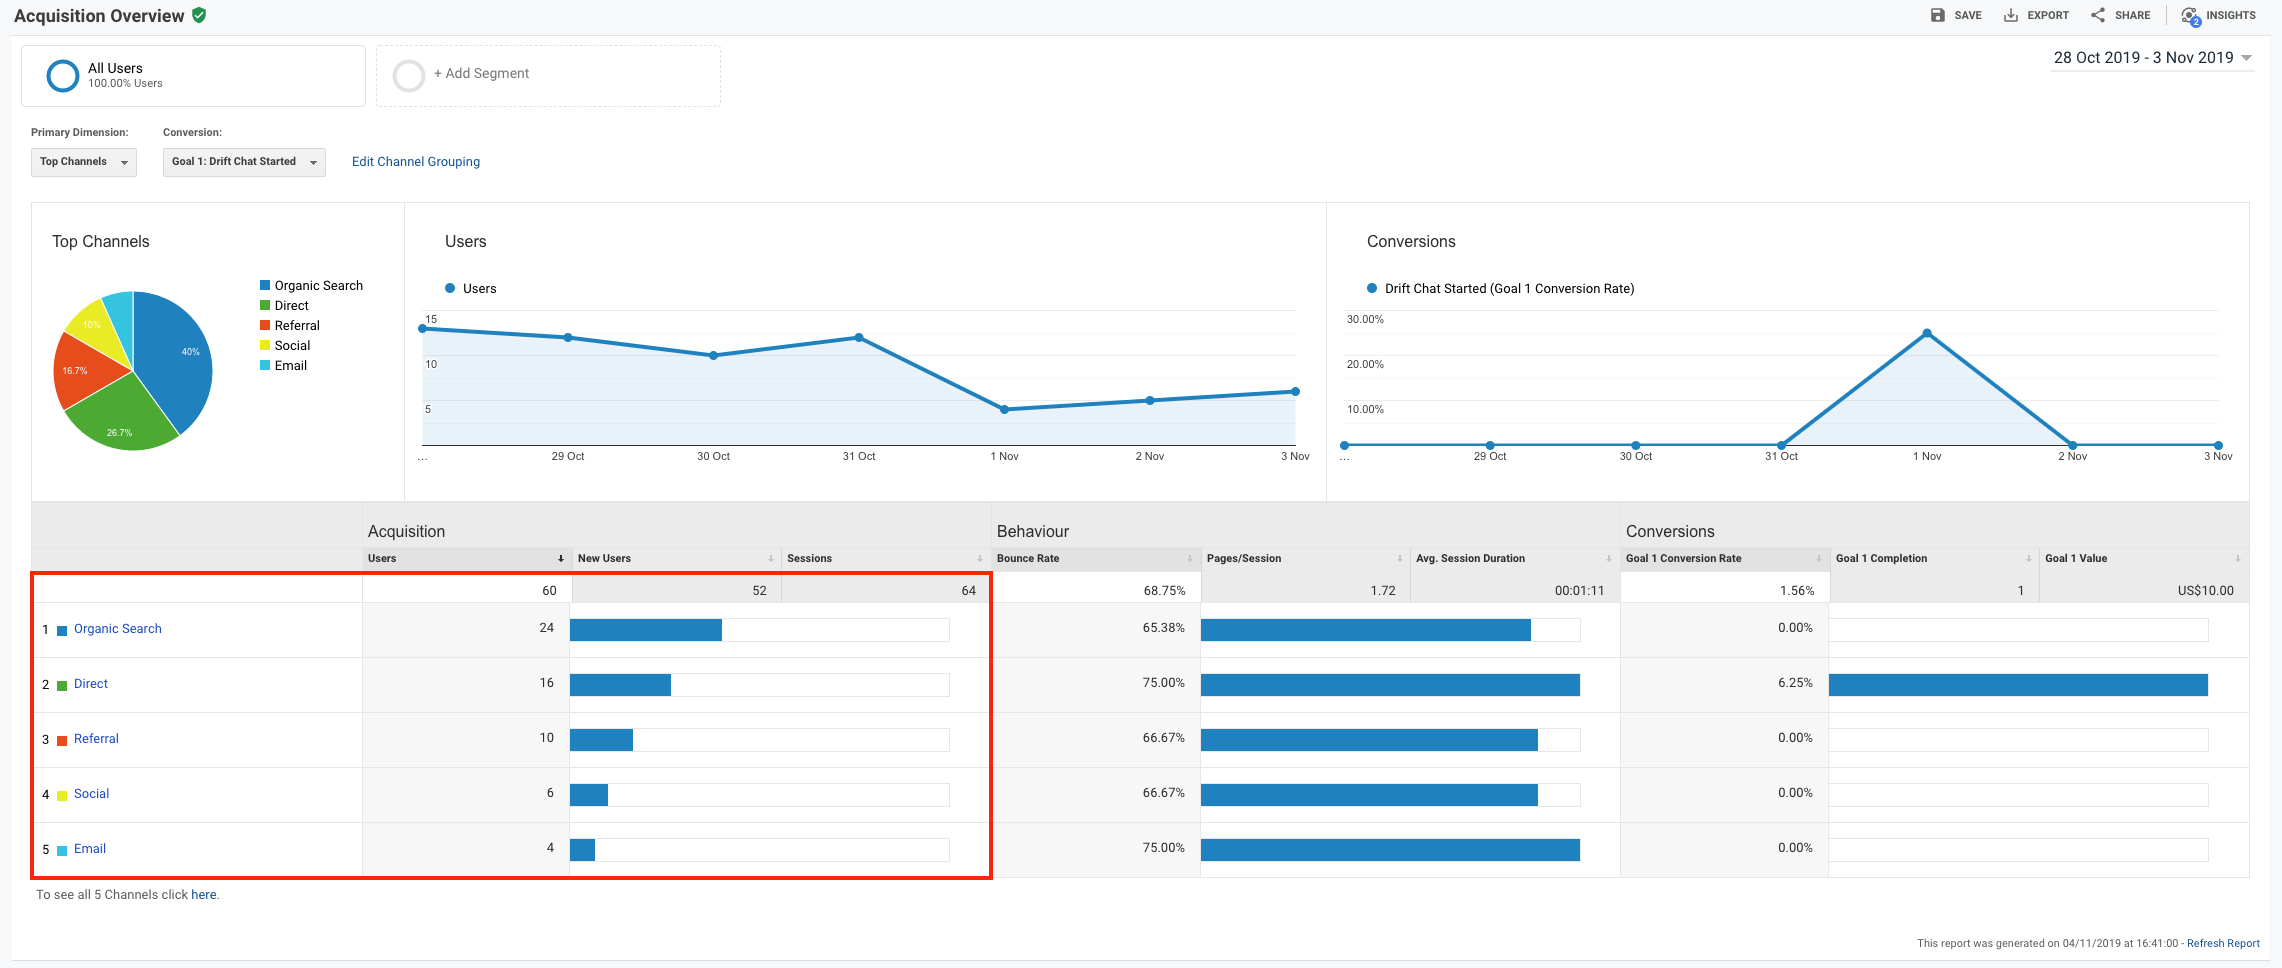
As you can see in the example below, GA gives you an acquisition overview of your different channels (highlighted in red) for your chosen time. This is the easiest way to get a quick summary of all of your data and identify your best acquisition sources. Pay close attention to your new users and the bounce rate as they are the things you want to work on improving.
The acquisition menu has options to view more in-depth analytics on specific channels such as Google Ads, search and social. These subcategories allow you to seriously assess which platforms and channels you should be focusing on if they're performing well. However, you can also determine which platforms could benefit from some improvements.

Behaviour
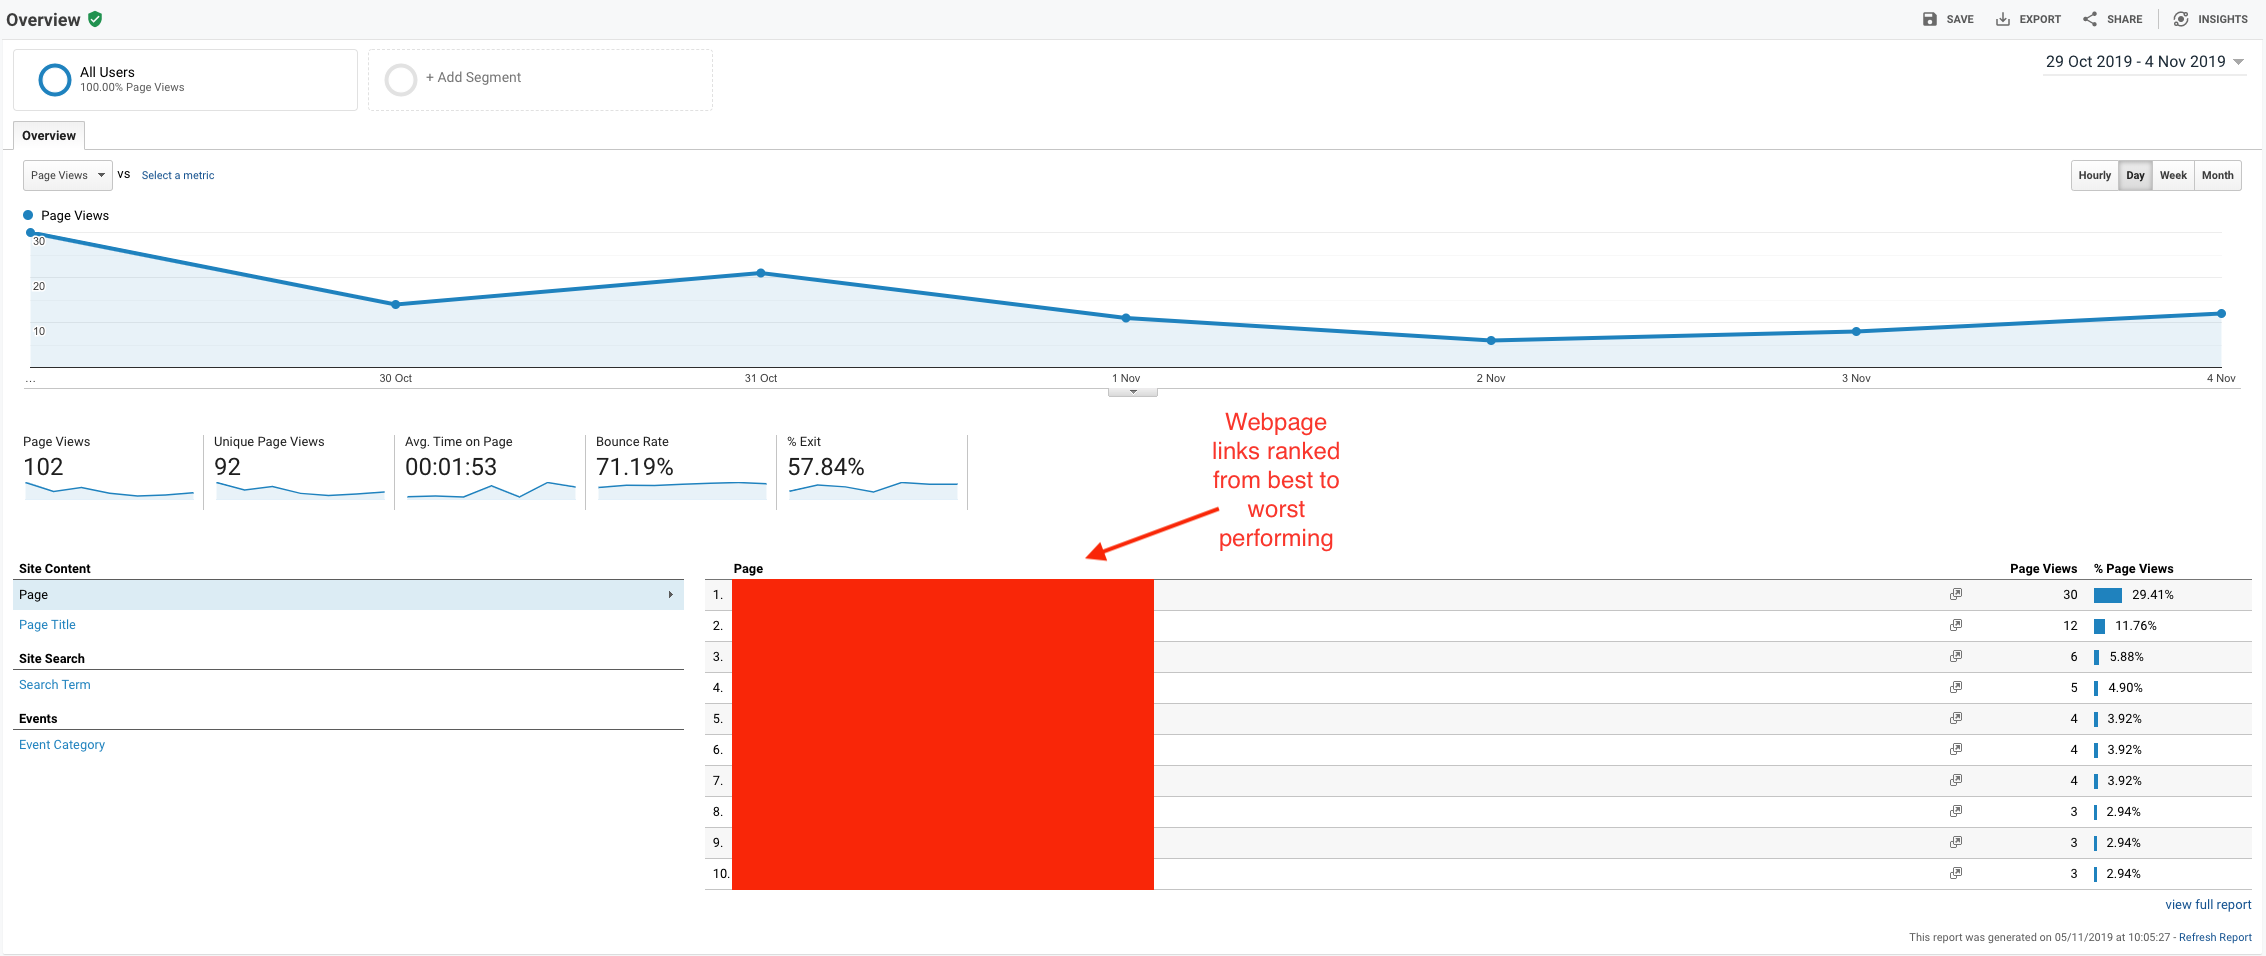
As you may have already guessed, behaviour reports keep track of what people are actually doing on your website. These metrics are useful for identifying which of your web pages and/or web content resonates best with your audience. This can help you determine whether you should continue publishing similar content or work on enhancing lower performing content.

You can also see page views, unique page views, the average time people spend on your page and the exit percentage. These all demonstrate how people are using your site, and your goal is to get your page views, unique page views and average time on page, to go up!

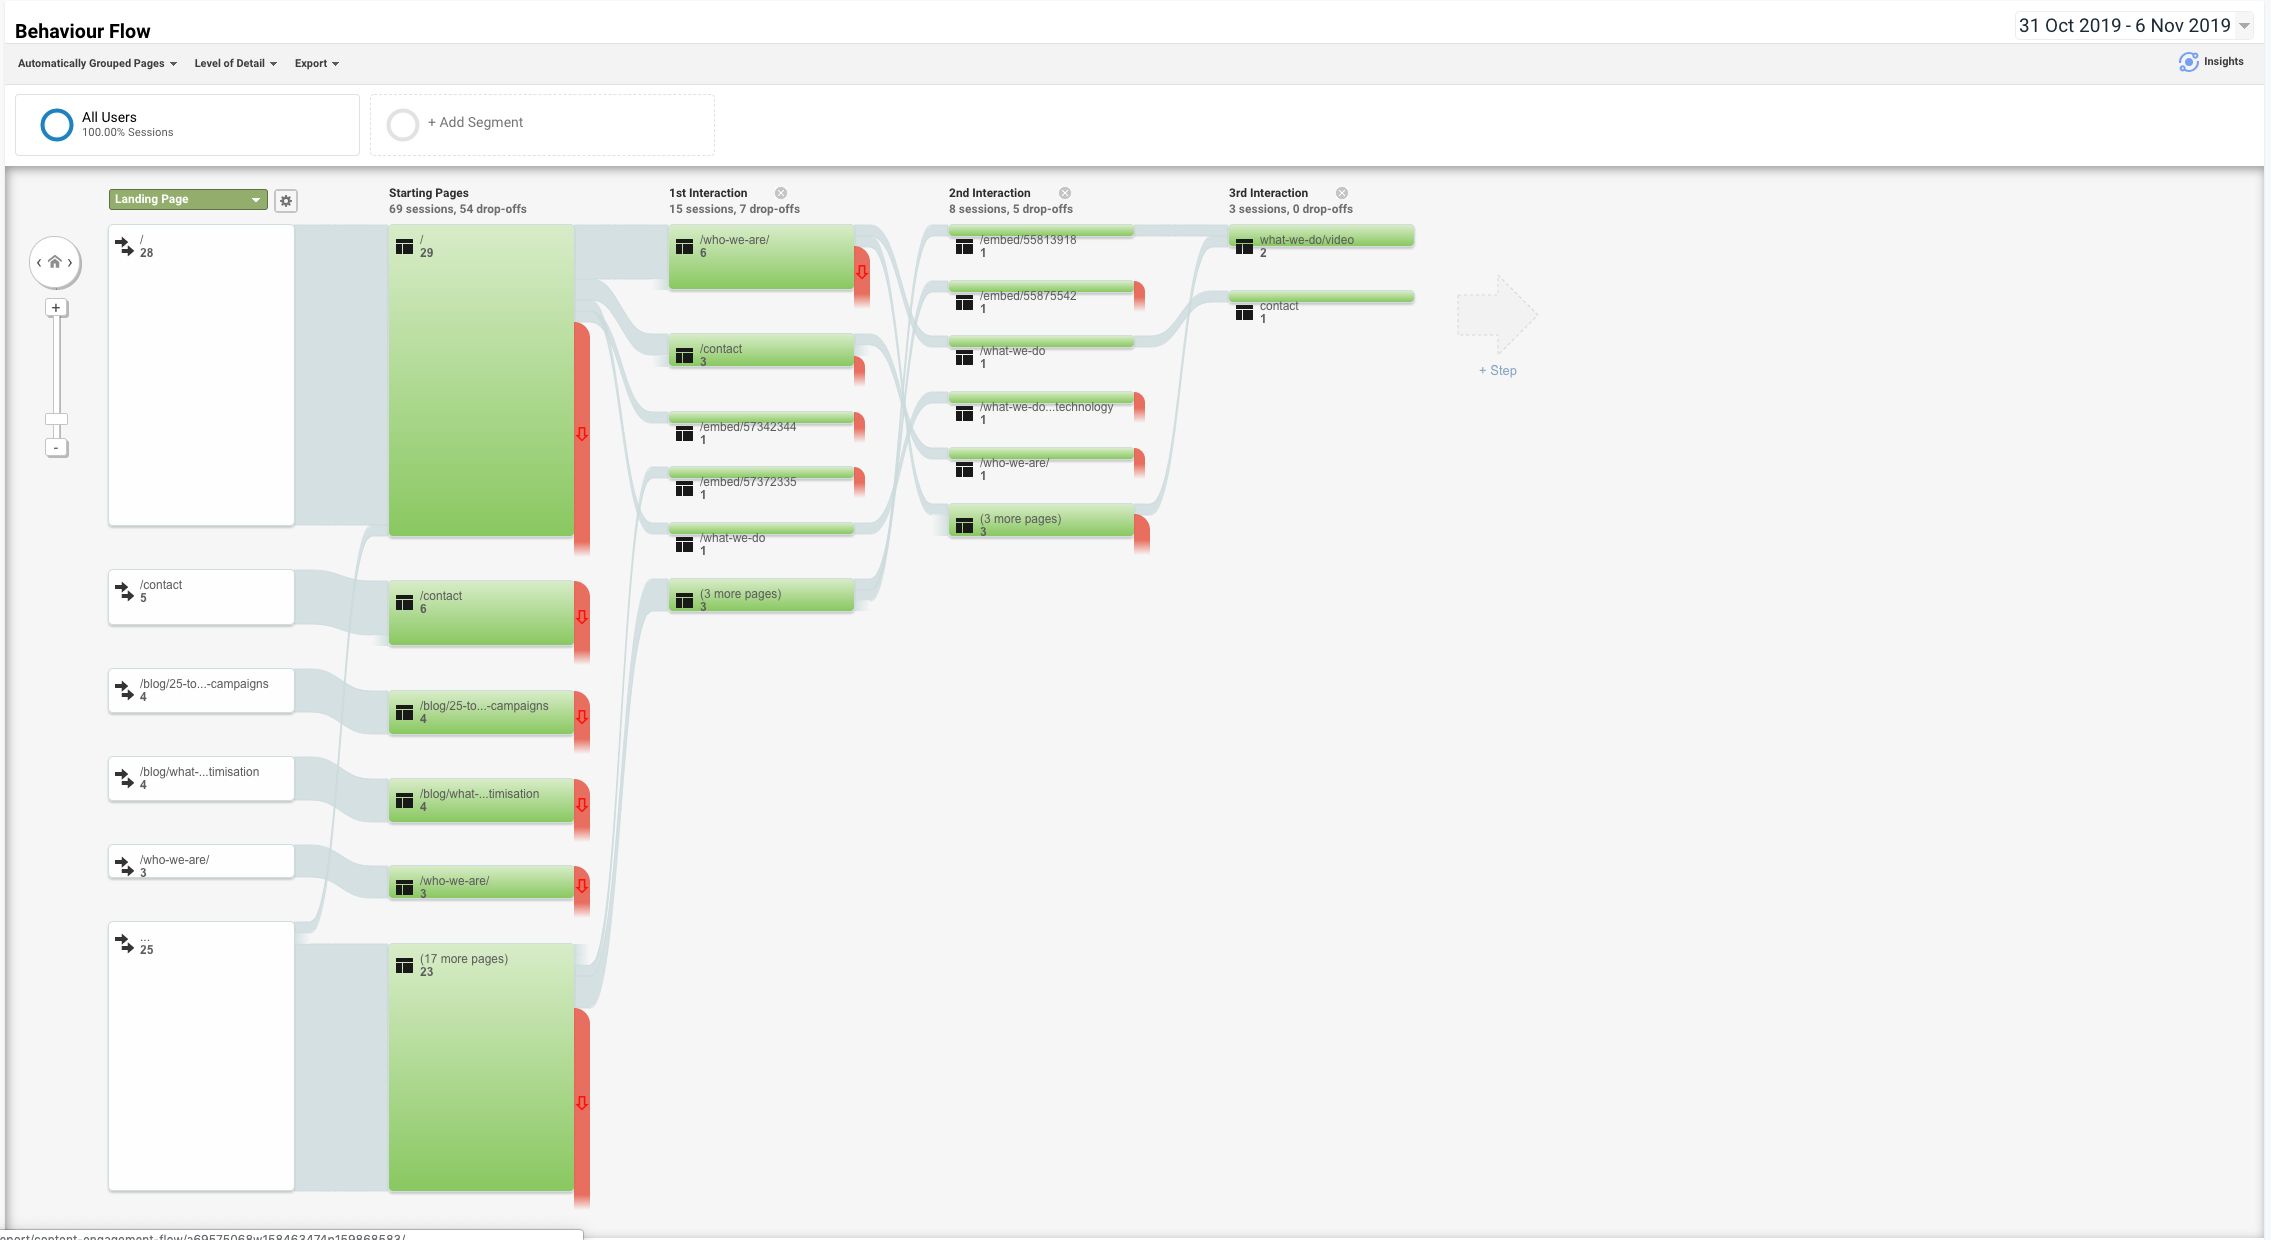
The behaviour flow view is an interesting take on how your website navigation translates into data. It shows how many people further explore your website from the initial interaction and how many read one page and then don't go any further. Your goal is to make your website easily navigational and engaging as possible so that people follow a smooth process to delve deeper into your site. This will raise the average time spent on your site, which usually translates to conversions.
Remember, the whole point of keeping track of your data this way is to provide more ROI and more conversions ultimately. You can only do this by knowing where your marketing efforts need improvement. Use data to make dough!
Of course, there are more options for what behavioural analytics you can assess, but when you're starting off, pay attention to your overview and behaviour flow.
Conversions
Not everyone's conversions are such a linear process, especially if you own a business where monetary transactions occur outside your website. The conversions section is made up of 3 subcategories; goals, eCommerce and multi-channel funnels.
Goals
You set your own goals depending on what you want to track; in our case, we can see how many people booked an exploratory call or a meeting. These are leads that can become conversions, so we want to track our lead generation efforts. Your goals should align with your business’s key performance indicators.
If you're an eCommerce business, you might prefer to track completed orders, discount code users or sign-ups. This can be a complicated process for analytical novices, and it might be best to enlist our help in setting this up, especially for eCommerce.
If you are going to use this data to dictate marketing efforts and inform success rates, you will need it to be accurate.
Goals work by tracking multiple steps in the conversion process, and you have to input the appropriate URLs. You can use a single URL or build the reverse goal path report to show the previous steps that lead to the conversion. This just ensures that your data is measured correctly. You can also use the funnel visualisation view under the Goals menu to get a better idea of how this works.
eCommerce
This section will only be relevant to those of you who own an eCommerce business. If you're unfamiliar with what that is, it just means you sell stuff online. This shows you things like your average sale value, unique purchases, units sold and conversion rates.
This is nothing new and are all metrics that have been tracked in traditional retail for decades. Many brick and mortar businesses use this data to measure the performance of their store/s and set KPIs for their staff, and the same can be done in eCommerce.
Product performance, sales performance, transactions and time to purchase are all data sources in the eCommerce section and are pretty straight forward. They help you to identify targets for your marketing and/or sales teams to hit.
The product performance data source measures your most to least popular products. Sales performance looks at your total revenue as well as daily sales achievements. Transaction reports look into your revenue, tax, shipping and order quantities purchased in each transaction. Finally, time to purchase measures how long it takes someone to buy from arrival to order completion.
Multi-Channel Funnels
This section allows you to get a well-rounded view of a customer's journey from acquisition to conversion on your site.
The buying process is not always linear; not everyone comes to your site intending to purchase. In fact, most people will stumble across you accidentally, maybe through a blog post or social ad. They might explore your website a bit before clicking away. It might even take them several visits to finally convert.
This is what the multi-channel funnel can tell us. By selecting certain channels, you can work out what percentage of people follow which patterns to convert. The top conversion paths menu is the best way to see this data clearly outlined in a ranking system so you can easily identify where people are coming from.
Audience
Saving the best till' last - we can't forget about your audience metrics! Your Audiences report allows you to divide your audience into groups based on a set of qualifying attributes.
We can't stress enough how vital it is that you understand your audience. Once you get a handle on what brings your visitors in, you can strategise ways to keep them coming, make them stay and get them to convert. You can choose to measure pre-existing audience data categories or create custom audiences.
For example, if you have an eCommerce store, you may want to track the people who abandoned their cart on your website. This is a very specific data source, and therefore you'll need to create this as a custom audience. These people are the perfect targets for remarketing campaigns, and it is useful to see if they're able to be converted after the fact. They're already invested, they just need to be
The pre-existing audience definitions are also handy for discovering how to best cater to your audience. You can obtain data on new users, existing users, page visitors, returning users, or users who completed a specific goal (e.g. completed a transaction). Google Analytics also has a smart list option where it manages your audience data for you based on what they think is most relevant.
Other than these particular audience data sources you can also check the following;
- Lifetime values - displays how you acquired your website users from the time of inception to the current day.
- Cohorts - people who are grouped together based on a common characteristic (e.g. acquisition date)
- User explorer - shows your users ID and how many sessions they're had on your site.
- Demographics - the gender and age of your primary audience.
- Interests - Google Analytics divides your audience into categories based on what they like the most.
- Geo - where your audience is, broken down by country and city.
- Behaviour - this measures what people are doing on your websites.
- Technology - which browsers, operating systems and networks your site visitors are using.
- Mobile - how many people are using your site on mobile as opposed to other devices and what kind of mobile devices they are using.
- Cross-device - helps you identify if/how your audience uses your site on multiple devices.
- Benchmarking - measure your performance against other industry categories.
Key Takeaways
- Google Analytics is a powerful free tool for tracking your marketing success
- Data is power, and website data is your key to success in the digital marketing world
- You can use website data to direct your marketing efforts and set KPIs for your team
- Conversion goals give your business direction and motivation to obtain more sales/ leads etc.
Even though it seems complex, anyone with a basic knowledge of the marketing resources they're using will be able to interpret these analytics. As much as we'd all like too, you can't cruise through business by conducting trial and error experiments and hoping that something sticks. It's expensive and rarely works.
You can get started with Google Analytics by signing up for free. You should also consider taking some courses at the Google Analytics Academy. The free Google Analytics Individual Qualification will give you a great background in advanced Google Analytics and understanding your data.
If you need help to navigate Google's tools, or just need a rundown of their entire suite, we're more than happy to help. Just book a FREE exploratory call with us to see how we can be of service. And, hey, we might even track your conversion with Google Analytics.


